Unpacking the Intricate Relationship Between Bitcoin and Inflation
It was only two years ago that an endorsement by legendary investor Paul Tudor Jones catapulted bitcoin’s potential as an inflation hedge into the mainstream. Since then, a number of other prominent macro investors, such as Stanley Druckenmiller and Ray Dalio, also built allocations on similar grounds. By now it’s clear that Jones’ “Great Monetary Inflation” thesis was proven correct and his bitcoin investment delivered a tremendous return.
But it was even more recently that inflationary concerns became the broad consensus in the market. Nobel laureate economist Paul Krugman was still defending the thesis that inflation would be transitory in mid-November. Since then, however, all five CPI prints marked new four-decade highs, with no signs of abating.
One puzzling aspect to all of this is that, now that inflation is unequivocally with us, bitcoin’s price performance has been underwhelming. Its average return on these five record-breaking inflation release days was a paltry -0.90%. This behaviour has led many—including enthusiasts, skeptics, and those in between—to question if bitcoin is actually an inflation hedge, just a proxy for tech stocks, or something else.
We at CIG have long been advocating that bitcoin can be better understood as an emerging monetary asset and hedge against inflation. What is less commonly understood is that over the last couple of years bitcoin has actually been making remarkable progress in establishing itself as such.
Bitcoin Price Action Versus Forward-Looking, High-Frequency Inflation Data
Measuring the sensitivity of asset returns to inflation is actually a much harder problem than meets the eye. Among many challenges, perhaps the most relevant is that inflation indices like the CPI reflect past data; they are most relevant to market price action only to the extent that they change future expectations. Another problem is that they only come once a month, which gives us a relatively small sample size to work with.
One still-imperfect but arguably better alternative is to focus on inflation expectations embedded in the U.S. Treasury market, or the so-called breakeven inflation rates. By looking at the difference between two equivalent assets that only differ in whether they offer inflation protection, one can get a forward-looking gauge of what the market thinks inflation will do going forward. Another advantage is that breakeven inflation rates are available continuously, therefore yielding us plenty of data points.
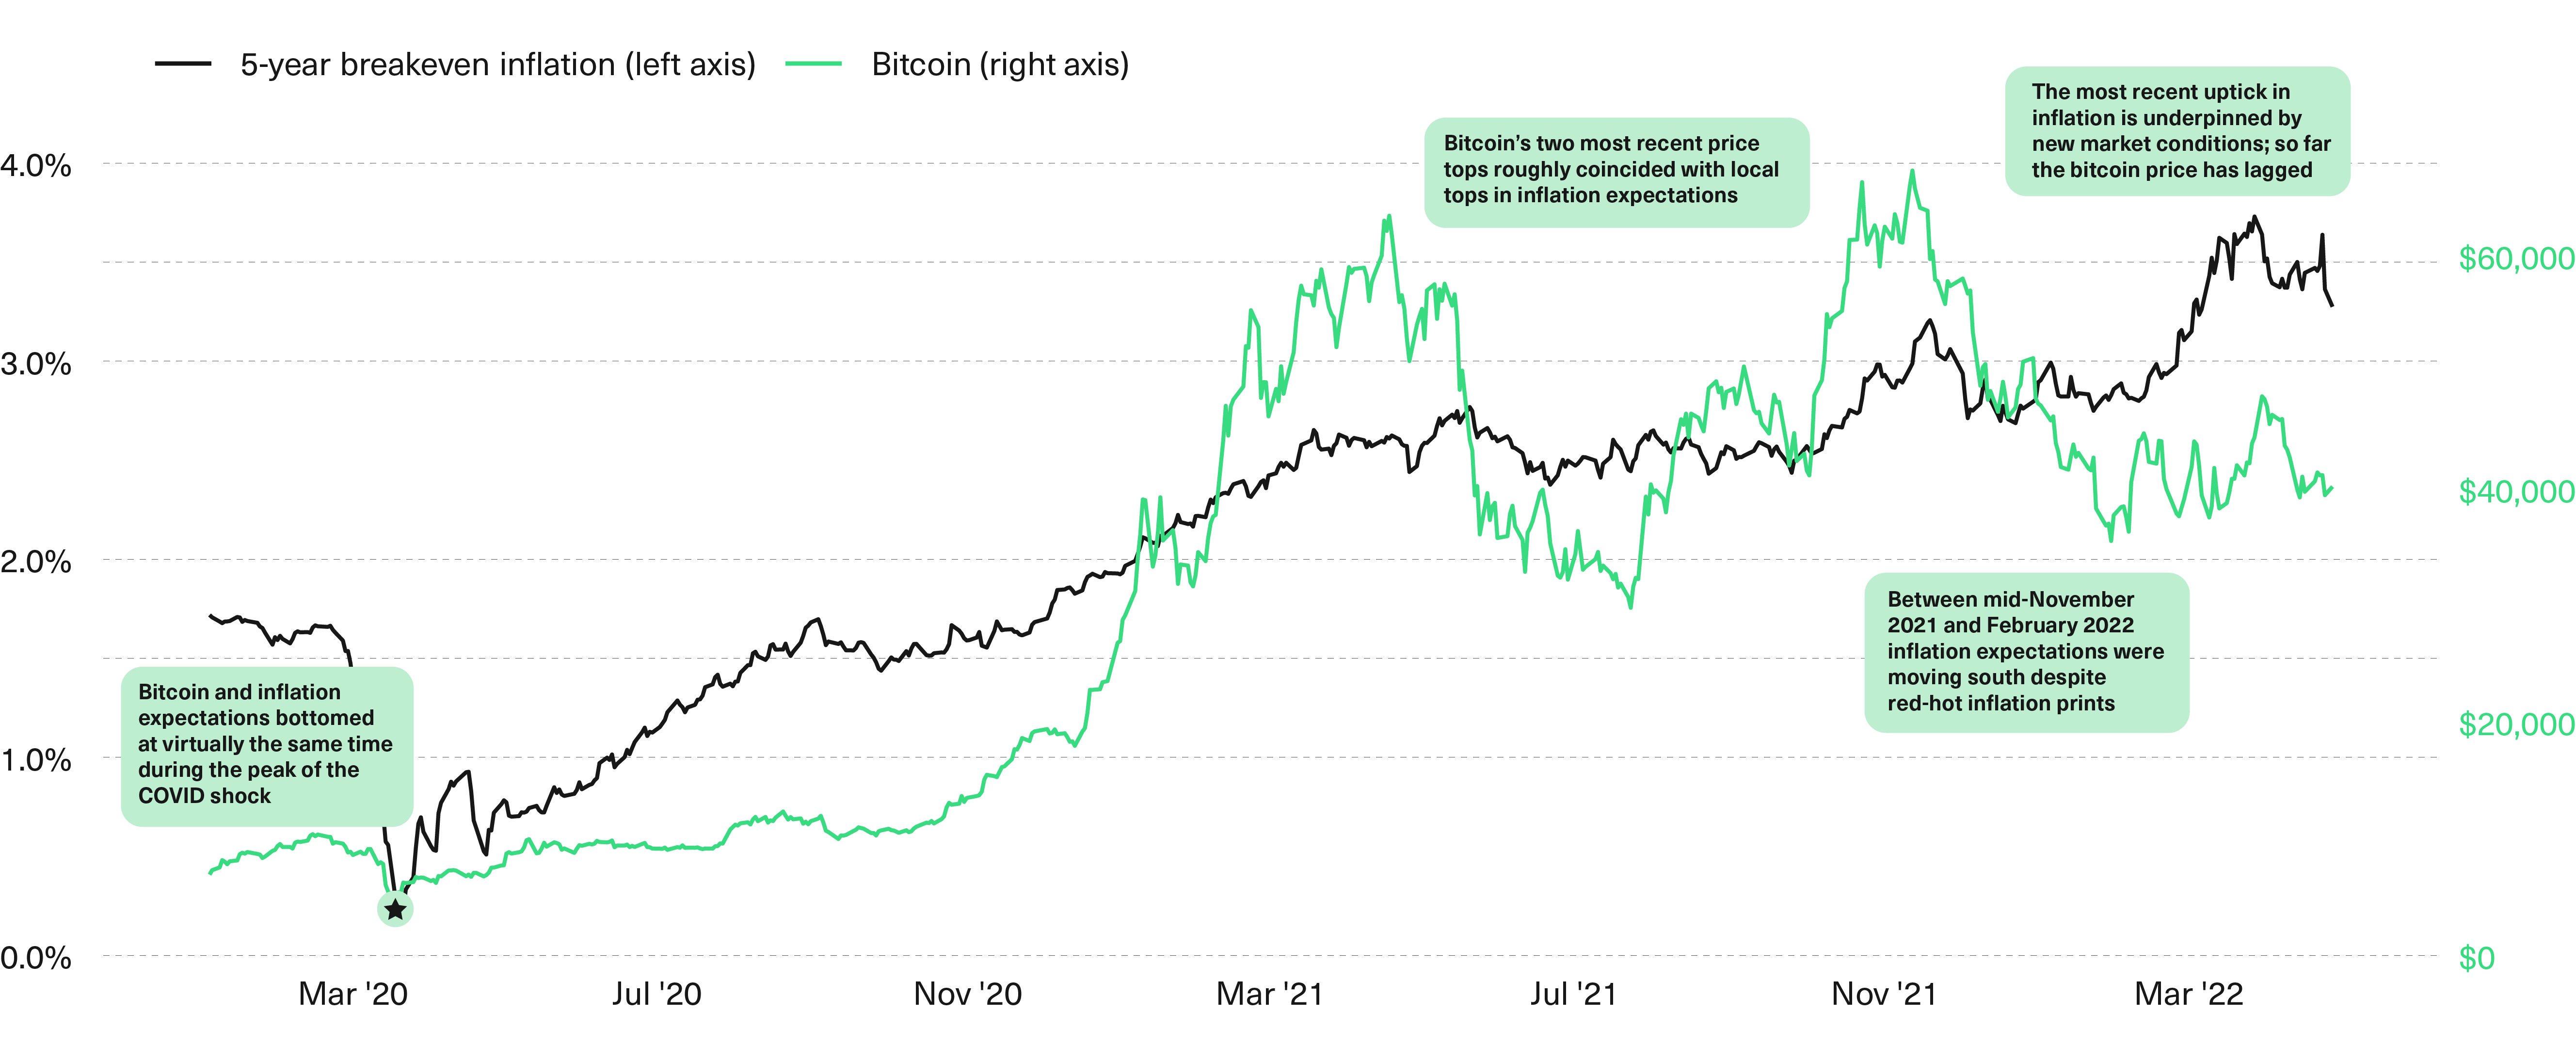
The chart below shows the price of bitcoin and the five-year inflation breakeven rate, or the market’s estimate of what inflation will be, on average, over the following five years. The data starts on January 1, 2020, which is shortly before the inflation narrative around bitcoin started to gain steam.
BITCOIN HAS ESTABLISHED A VISIBLE RELATIONSHIP WITH INFLATION EXPECTATIONS SINCE 2020
how can we help you?
Stay in the know
Stay abreast of the latest news, insights, and trends in crypto.

The chart above shows an imperfect, sometimes laggy, but most of the time clear relationship between the price of bitcoin and inflation expectations. For example, bitcoin bottomed during the COVID crisis virtually at the same time inflation expectations did, and the April and November 2021 bitcoin market tops also roughly coincided with local tops in inflation expectations.
It also helps explain why bitcoin did not perform well during the record-high CPI prints that came out between November 2021 and the first couple of months of 2022. The reason is that inflation expectations during that time it actually going down, not up. It might sound counterintuitive, but red-hot inflation today can sometimes translate into lower future inflation expectations as a result of the Fed being incentivized to take a firmer stance to fight inflation from there on.
But the chart above also leaves an open question: Why is bitcoin lagging despite inflation expectations jumping higher over the last couple of months?
The Bitcoin/Inflation Relationship in the Present Market Environment
Contrary to the previous recent upticks in inflation expectations, which came on the back of consistently increasing monetary and fiscal stimuli, the most recent one comes amid additional concerns. Part of the more recent inflation pressure is coming from the Ukraine war, which triggered disruptions in key commodity markets. The increasingly hawkish rhetoric from the Fed and other central banks so far has not been enough to offset this trend, and is also raising concerns about how far they can tighten before something breaks in the real economy.
Under this backdrop, the relationship between changes in inflation expectations and risk asset returns has been turning more complex. For some assets, such as commodities, rising inflation expectations in this new environment have been a boon while for others, such as high-flying growth assets, they have been a curse.
The bitcoin investment case sits somewhere in between these two extremes. On one hand, many are increasingly recognizing it as a commodity whose intrinsic properties can provide shelter against monetary mismanagement. On the other hand, most place it in the “potentially disruptive but yet unproven technology” bucket, and some still cast doubt on its entire raison d’être in the first place.
But the data shows that the former group—bitcoin as an inflation hedge—is making significant headway against the latter.
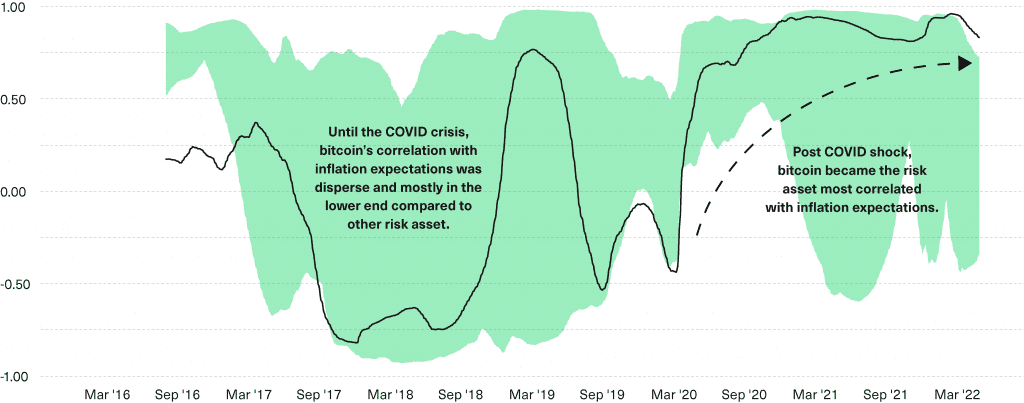
The chart below shows the correlations between changes in inflation expectations and the returns of bitcoin (black line) and 13 other risk assets including domestic and international equities, bonds, commodities, and real estate (aggregated in the green shade). All asset prices are smoothed by applying a 90-day moving average so as to filter out the short-term market gyrations and allow us to focus on the longer-term trend at play.
BITCOIN’S EMERGENCE AS A INFLATION HEDGE
One-year rolling correlations of daily returns for bitcoin (black line) and select risk assets (green shade) versus changes in five-year breakeven inflation, smoothed by 90-day moving average. Data from January 1, 2016 to April 25, 2022.

The green shade includes data from the following assets and indices: S&P 500 Index (SPX), Nasdaq Composite Index (CCMP), Russell 2000 Index (RTY), MSCI Emerging Markets Index (MXEF), Ark Innovation ETF (ARKK), Gold (United States Dollar Spot, XAU), Oil (WTI Cushing OK Spot, USCRWTIC), Bloomberg Commodity Index (BCOM), iShares iBoxx Investment Grade Corporate Bond ETF (LQD), iShares iBoxx High Yield Corporate Bond ETF (HYG), Bloomberg Emerging Markets Hard Currency Aggregate Index (EMUSTRUU), MSCI U.S. REIT Index (RMZ), and MSCI World Real Estate Index (MXWOORE).
The data above shows that until the COVID crisis, correlations between bitcoin returns and changes in inflation expectations were trend-less. In fact, most of the time they were in the bottom range among other risk assets. Since then, however, a remarkable trend has taken over, with bitcoin moving from being the asset least correlated with the market’s inflation expectations to the asset that is most correlated with that factor. In our view, the most likely explanation for this shift is an increasing number of market participants—from macro investors, corporations, and insurance companies to financial advisors—recognizing bitcoin’s role as a potential inflation hedge.
The excesses and mismanagement in monetary policy of the last couple of years are making bitcoin’s unique value proposition—to offer a credible fixed monetary policy and also be transferred digitally—increasingly clear. As an emerging asset, it might be hard to identify the increasing understanding of bitcoin’s role, but the long-term trend shows an encouraging story. If the stronger long-term relationship between inflation and bitcoin is sustained, this is big news for bitcoin’s role both in investors’ portfolios and in the economy more broadly.
